Tuning
This section provides tips on how to improve the performance of your cloud.
Performance Monitoring
Host and guest performance monitoring is available to end users and administrators. This allows the user to monitor their utilization of resources and determine when it is appropriate to choose a more powerful service offering or larger disk.
Increase Management Server Maximum Memory
If the Management Server is subject to high demand, the default maximum JVM memory allocation can be insufficient. To increase the memory:
Edit the Tomcat configuration file:
/etc/cloudstack/management/tomcat6.conf
Change the command-line parameter -XmxNNNm to a higher value of N.
For example, if the current value is -Xmx128m, change it to -Xmx1024m or higher.
To put the new setting into effect, restart the Management Server.
# service cloudstack-management restart
For more information about memory issues, see “FAQ: Memory” at Tomcat Wiki.
Set Database Buffer Pool Size
It is important to provide enough memory space for the MySQL database to cache data and indexes:
Edit the MySQL configuration file:
/etc/my.cnf
Insert the following line in the [mysqld] section, below the datadir line. Use a value that is appropriate for your situation. We recommend setting the buffer pool at 40% of RAM if MySQL is on the same server as the management server or 70% of RAM if MySQL has a dedicated server. The following example assumes a dedicated server with 1024M of RAM.
innodb_buffer_pool_size=700M
Restart the MySQL service.
# service mysqld restart
For more information about the buffer pool, see “The InnoDB Buffer Pool” at MySQL Reference Manual.
Monitor the Database Load
The load of the database is monitored. By default the queries for each minute are calculated in queries per second. Three values are retaint by default. In the UI these are visible under the DB/Usage Server page under the infrastructure menu.
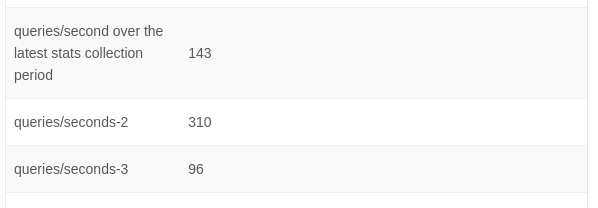
The configuration variable ‘database.server.stats.interval’ can be set to change the interval, which is 60 seconds by default.
The value of ‘database.server.stats.retention’ can be changed to tweak the number of values that are maintained.
Set and Monitor Total VM Limits per Host
The CloudStack administrator should monitor the total number of VM instances in each cluster, and disable allocation to the cluster if the total is approaching the maximum that the hypervisor can handle. Be sure to leave a safety margin to allow for the possibility of one or more hosts failing, which would increase the VM load on the other hosts as the VMs are automatically redeployed. Consult the documentation for your chosen hypervisor to find the maximum permitted number of VMs per host, then use CloudStack global configuration settings to set this as the default limit. Monitor the VM activity in each cluster at all times. Keep the total number of VMs below a safe level that allows for the occasional host failure. For example, if there are N hosts in the cluster, and you want to allow for one host in the cluster to be down at any given time, the total number of VM instances you can permit in the cluster is at most (N-1) * (per-host-limit). Once a cluster reaches this number of VMs, use the CloudStack UI to disable allocation of more VMs to the cluster.
Configure XenServer dom0 Memory
Configure the XenServer dom0 settings to allocate more memory to dom0. This can enable XenServer to handle larger numbers of virtual machines. We recommend 2940 MB of RAM for XenServer dom0. For instructions on how to do this, see Citrix Knowledgebase Article.The article refers to XenServer 5.6, but the same information applies to XenServer 6